
Statistics
Number of scientific departments in the college = 6 departments (Economic, Business Administration, Accounting, Statistics, Financing and banking, Information management system)
Numbers of teaching staff according to the certificate |
||||||||||||
Scintific department |
||||||||||||
Academic year |
Economics |
Business administration |
Accounting |
Statistics |
Banking &financial sciences |
Management information system |
||||||
ph.D |
master |
ph.D |
master |
ph.D |
master |
ph.D |
master |
ph.D |
master |
ph.D |
master |
|
| 2024_2025 |
14 |
21 |
14 |
20 |
11 |
23 |
7 |
9 |
21 |
17 |
4 |
15 |
2023_2024 |
16 |
12 |
12 |
18 |
11 |
10 |
8 |
8 |
18 |
18 |
6 |
11 |
2022_2023 |
13 |
14 |
12 |
17 |
9 |
9 |
6 |
11 |
15 |
19 |
5 |
15 |
2021_2022 |
16 |
9 |
14 |
10 |
12 |
8 |
4 |
11 |
19 |
12 |
2 |
9 |
2020_2021 |
17 |
9 |
15 |
11 |
10 |
9 |
4 |
13 |
16 |
16 |
2 |
7 |
 |
||||||||||||
Numbers of the teaching staff accourding to the scintific title |
||||||||||||||||||||||||
academic year |
scintific department |
|||||||||||||||||||||||
economics |
business administration |
accounting |
statistics |
banking and financial sciences |
management information system |
|||||||||||||||||||
prof. |
assist. Prof. |
L. |
assist. L. |
prof. |
assist. Prof. |
L. |
assist. L. |
prof. |
assist. Prof. |
L. |
assist. L. |
prof. |
assist. Prof. |
L. |
assist. L. |
prof. |
assist. Prof. |
L. |
assist. L. |
prof. |
assist. Prof. |
L. |
assist. L. |
|
| 2024_2025 |
9 |
7 |
4 |
15 |
7 |
7 |
10 |
10 |
2 |
9 |
5 |
18 |
1 |
8 |
2 |
5 |
5 |
10 |
13 |
10 |
0 |
3 |
6 |
10 |
2023_2024 |
8 |
8 |
6 |
6 |
5 |
8 |
9 |
8 |
3 |
10 |
5 |
3 |
1 |
7 |
5 |
3 |
6 |
10 |
10 |
10 |
0 |
3 |
6 |
8 |
2022_2023 |
8 |
9 |
8 |
2 |
4 |
7 |
9 |
8 |
2 |
9 |
2 |
5 |
2 |
7 |
7 |
1 |
4 |
6 |
11 |
13 |
0 |
4 |
5 |
11 |
2021_2022 |
8 |
12 |
5 |
0 |
4 |
9 |
8 |
3 |
2 |
11 |
3 |
4 |
1 |
7 |
7 |
0 |
5 |
7 |
15 |
4 |
0 |
2 |
6 |
3 |
2020_2021 |
8 |
10 |
6 |
2 |
3 |
8 |
9 |
6 |
2 |
10 |
2 |
5 |
1 |
5 |
10 |
1 |
5 |
6 |
11 |
10 |
0 |
2 |
3 |
4 |
 |
||||||||||||||||||||||||
The total number primarily studies students in each department |
|||||||
Academic year |
Economics |
Business administration |
Accounting |
Statistics |
Banking &financial sciences |
Management information system |
Total |
| 2024_2025 | 864 |
1932 |
1951 |
263 |
2115 |
745 |
7870 |
2023_2024 |
1000 |
1906 |
2016 |
265 |
1909 |
664 |
7760 |
2022_2023 |
836 |
1388 |
1363 |
280 |
1492 |
461 |
5820 |
2021_2022 |
860 |
1247 |
1155 |
317 |
1313 |
440 |
5332 |
2020_2021 |
988 |
1294 |
1108 |
376 |
1340 |
388 |
5494 |
2020 - 2019 |
834 |
961 |
818 |
334 |
1102 |
163 |
4212 |
2019 - 2018 |
794 |
1330 |
1223 |
450 |
1445 |
82 |
5324 |
2018 - 2017 |
1368 |
1330 |
1490 |
654 |
1716 |
|
6558 |
2017 - 2016 |
1389 |
1585 |
1466 |
554 |
1550 |
|
6544 |
2016 - 2015 |
1327 |
1555 |
1497 |
762 |
1470 |
|
6611 |
2015 - 2014 |
1266 |
1673 |
1651 |
474 |
1423 |
|
6487 |
2014 - 2013 |
996 |
1653 |
1383 |
704 |
1449 |
|
6185 |
2013 - 2012 |
1153 |
1381 |
1264 |
724 |
1333 |
|
5855 |
2012 - 2011 |
864 |
1204 |
1083 |
450 |
1020 |
|
4621 |
2011 - 2010 |
987 |
1131 |
1071 |
621 |
1123 |
|
4933 |
 |
|||||||
Ratio of the numbers of lecturers to the numbers of students |
||||||||||||||||||
academic year |
Economics |
Business administration |
Accounting |
Statistics |
Banking & financial scinces |
Management information system |
||||||||||||
lecturers numbers |
students nubers |
ratio |
lecturers numbers |
students nubers |
ratio |
lecturers numbers |
students nubers |
ratio |
lecturers numbers |
students nubers |
ratio |
lecturers numbers |
students nubers |
ratio |
lecturers numbers |
students nubers |
ratio |
|
2024_2025 |
35 |
864 |
4% |
34 |
1932 |
2% |
34 |
1951 |
2% |
16 |
263 |
6% |
38 |
2115 |
2% |
19 |
745 |
3% |
2023_2024 |
28 |
1000 |
3% |
30 |
1906 |
2% |
21 |
2016 |
1% |
16 |
265 |
6% |
36 |
1909 |
2% |
17 |
664 |
3% |
2022_2023 |
27 |
836 |
3% |
29 |
1388 |
2% |
18 |
1363 |
1% |
17 |
280 |
6% |
34 |
1492 |
2% |
20 |
461 |
4% |
2021_2022 |
25 |
860 |
3% |
24 |
1247 |
2% |
20 |
1155 |
2% |
15 |
317 |
5% |
31 |
1313 |
2% |
11 |
440 |
3% |
2020_2021 |
26 |
988 |
3% |
26 |
1294 |
2% |
19 |
1108 |
2% |
17 |
376 |
5% |
32 |
1340 |
2% |
9 |
388 |
2% |
 |
||||||||||||||||||
Statistics on research's number |
||||
Academic year |
Number of planned research |
Number of completed research |
Number of published research |
Number of research accepted for publication |
| 2024_2025 |
265 |
238 |
101 |
8 |
2023_2024 |
333 |
185 |
68 |
12 |
2022_2023 |
185 |
175 |
126 |
29 |
2021_2022 |
167 |
73 |
23 |
34 |
2020_2021 |
141 |
30 |
3 |
27 |
2019_2020 |
123 |
18 |
18 |
0 |
2018_2019 |
344 |
0 |
25 |
42 |
2017_2018 |
150 |
122 |
33 |
89 |
2016_2017 |
118 |
46 |
9 |
9 |
2015_2016 |
132 |
79 |
4 |
21 |
2014_2015 |
75 |
50 |
11 |
3 |
2013_2014 |
61 |
0 |
0 |
0 |
2012_2013 |
56 |
45 |
2 |
9 |
2011_2012 |
118 |
52 |
8 |
13 |
2010_2011 |
125 |
66 |
30 |
35 |
 |
||||
Number of registered primarily studies students (first stage) for each department |
|||||||
Academic year |
Economics |
Business administration |
Accounting |
Statistics |
Banking & financial sciences |
Management information system |
Total |
2024_2025 |
210 |
599 |
434 |
132 |
797 |
251 |
2423 |
2023_2024 |
301 |
710 |
778 |
38 |
763 |
249 |
2839 |
2022_2023 |
214 |
477 |
439 |
103 |
465 |
139 |
1837 |
2021_2022 |
215 |
228 |
253 |
81 |
217 |
100 |
1094 |
2020_2021 |
274 |
471 |
451 |
101 |
405 |
230 |
1932 |
2020 - 2019 |
171 |
232 |
157 |
108 |
261 |
81 |
1010 |
2019 - 2018 |
201 |
182 |
173 |
91 |
204 |
82 |
933 |
2018 - 2017 |
390 |
550 |
519 |
198 |
198 |
|
1855 |
2017 - 2016 |
340 |
557 |
483 |
161 |
526 |
|
2067 |
2016 - 2015 |
408 |
149 |
351 |
199 |
388 |
|
1495 |
2015 - 2014 |
240 |
521 |
469 |
241 |
531 |
|
2002 |
2014 - 2013 |
229 |
464 |
391 |
148 |
403 |
|
1635 |
2013 - 2012 |
436 |
|
|
258 |
|
|
694 |
2012 - 2011 |
251 |
353 |
428 |
310 |
323 |
|
1665 |
2011 - 2010 |
300 |
425 |
368 |
|
364 |
|
1457 |
 |
|||||||
Number of postgraduate students (first year) for each department |
|||||||
Academic year |
Economics |
Business administration |
Accounting |
Statistics |
Banking & financial sciences |
Management information system |
Total |
| 2024_2025 |
42 |
72 |
27 |
24 |
42 |
0 |
207 |
2023_2024 |
14 |
28 |
11 |
15 |
25 |
0 |
93 |
2022_2023 |
29 |
35 |
12 |
11 |
19 |
0 |
106 |
2021_2022 |
16 |
32 |
19 |
8 |
12 |
0 |
87 |
2020_2021 |
23 |
54 |
22 |
15 |
18 |
0 |
132 |
2020 - 2019 |
24 |
35 |
13 |
14 |
16 |
0 |
102 |
2019 - 2018 |
13 |
25 |
2 |
0 |
15 |
0 |
55 |
2018 - 2017 |
21 |
22 |
14 |
0 |
10 |
0 |
67 |
2017 - 2016 |
25 |
30 |
14 |
0 |
12 |
0 |
81 |
2016 - 2015 |
30 |
26 |
5 |
8 |
7 |
0 |
76 |
2015 - 2014 |
20 |
14 |
6 |
0 |
11 |
0 |
51 |
2014 - 2013 |
20 |
13 |
11 |
5 |
4 |
0 |
53 |
2013 - 2012 |
36 |
16 |
13 |
8 |
8 |
0 |
81 |
2012 - 2011 |
20 |
18 |
6 |
0 |
0 |
0 |
44 |
2011 - 2010 |
4 |
7 |
6 |
0 |
0 |
0 |
17 |
 |
|||||||
Number of bachelor's graduates for each department |
|||||||
Academic year |
Economics |
Business administration |
Accounting |
Statistics |
Banking & financial sciences |
Management information system |
Total |
2024_2025 |
178 |
471 |
554 |
29 |
326 |
63 |
1621 |
2023_2024 |
184 |
312 |
141 |
54 |
313 |
163 |
1167 |
2022_2023 |
173 |
181 |
52 |
52 |
143 |
55 |
656 |
2021_2022 |
141 |
169 |
154 |
20 |
188 |
|
672 |
2020_2021 |
217 |
250 |
188 |
85 |
249 |
|
989 |
2020 - 2019 |
167 |
152 |
161 |
88 |
213 |
|
781 |
2019 - 2018 |
141 |
108 |
109 |
97 |
110 |
|
565 |
2018 - 2017 |
253 |
208 |
215 |
130 |
212 |
|
1018 |
2017 - 2016 |
290 |
401 |
300 |
183 |
374 |
|
1548 |
2016 - 2015 |
284 |
224 |
215 |
91 |
251 |
|
1065 |
2015 - 2014 |
234 |
294 |
300 |
178 |
313 |
|
1319 |
2014 - 2013 |
247 |
280 |
273 |
116 |
315 |
|
1231 |
2013 - 2012 |
187 |
270 |
171 |
142 |
259 |
|
1029 |
2012 - 2011 |
109 |
126 |
109 |
108 |
183 |
|
635 |
2011 - 2010 |
123 |
97 |
143 |
70 |
139 |
|
572 |
2010 - 2009 |
153 |
169 |
124 |
106 |
194 |
|
746 |
 |
|||||||
Number of graduates of the higher diploma for each department |
|||||||
Academic year |
Economics |
Business administration |
Accounting |
Statistics |
Banking & financial sciences |
Management information system |
Total |
2024_2025 |
2 |
6 |
0 |
0 |
0 |
0 |
8 |
2023_2024 |
0 |
4 |
0 |
0 |
0 |
0 |
4 |
2022_2023 |
0 |
3 |
0 |
0 |
0 |
0 |
3 |
2021_2022 |
0 |
5 |
0 |
0 |
0 |
0 |
5 |
2020_2021 |
2 |
23 |
0 |
0 |
0 |
|
25 |
2020 - 2019 |
0 |
1 |
0 |
0 |
0 |
|
1 |
2019 - 2018 |
9 |
5 |
0 |
0 |
0 |
|
14 |
2018 - 2017 |
9 |
6 |
0 |
0 |
0 |
|
15 |
2017 - 2016 |
6 |
8 |
0 |
0 |
0 |
|
14 |
2016 - 2015 |
10 |
8 |
0 |
0 |
0 |
|
18 |
2015 - 2014 |
11 |
0 |
0 |
0 |
0 |
|
11 |
2014 - 2013 |
5 |
0 |
0 |
0 |
0 |
|
5 |
2013 - 2012 |
12 |
0 |
0 |
0 |
0 |
|
12 |
 |
|||||||
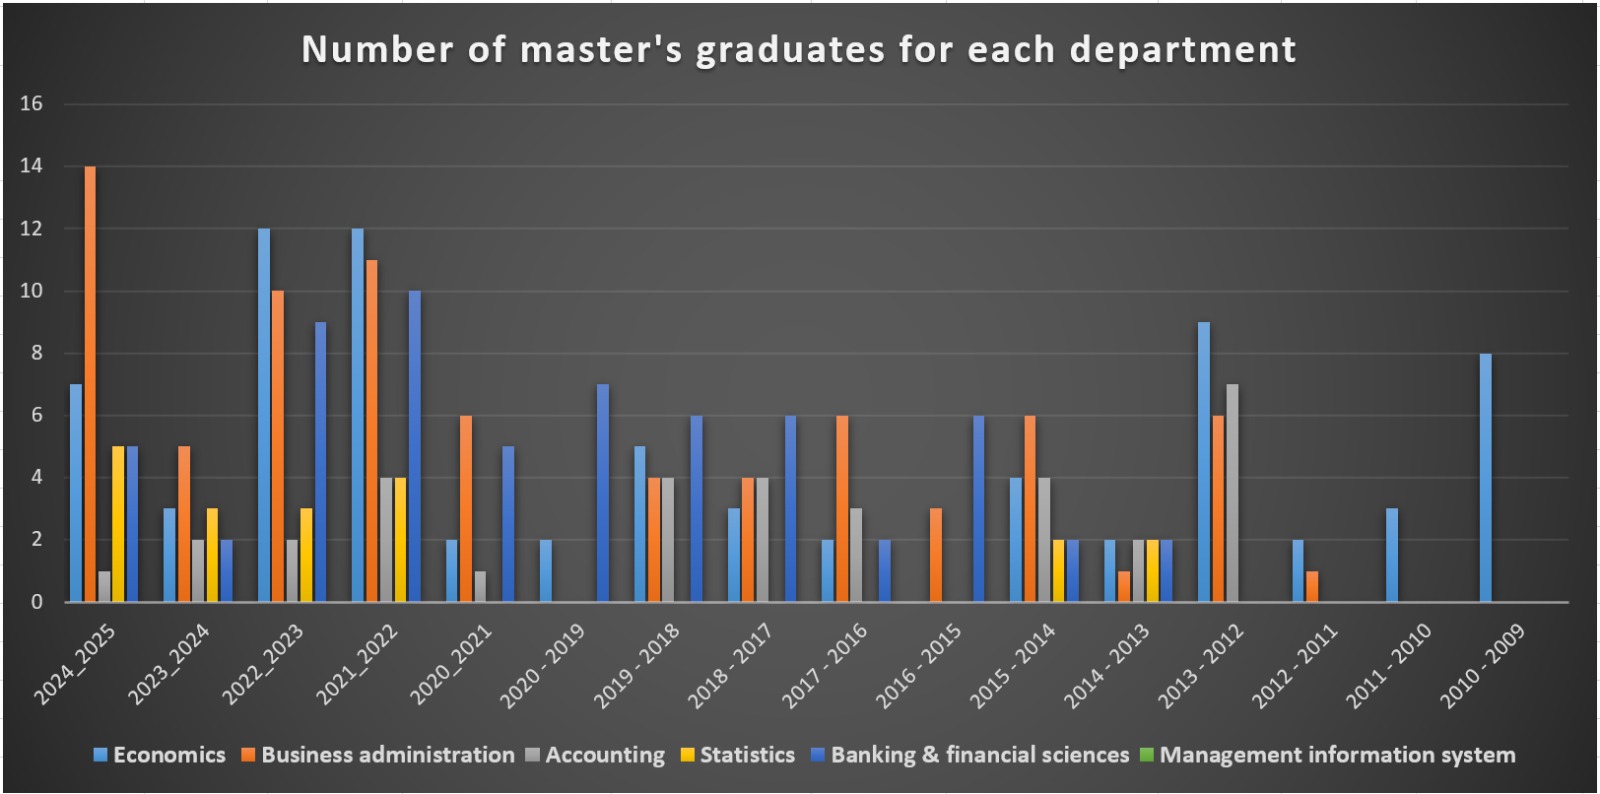
Number of master's graduates for each department |
|||||||
Academic year |
Economics |
Business administration |
Accounting |
Statistics |
Banking & financial sciences |
Management information system |
Total |
2024_2025 |
7 |
14 |
1 |
5 |
5 |
0 |
32 |
2023_2024 |
3 |
5 |
2 |
3 |
2 |
0 |
15 |
2022_2023 |
12 |
10 |
2 |
3 |
9 |
0 |
36 |
2021_2022 |
12 |
11 |
4 |
4 |
10 |
0 |
41 |
2020_2021 |
2 |
6 |
1 |
0 |
5 |
0 |
14 |
2020 - 2019 |
2 |
0 |
0 |
0 |
7 |
0 |
9 |
2019 - 2018 |
5 |
4 |
4 |
0 |
6 |
0 |
19 |
2018 - 2017 |
3 |
4 |
4 |
0 |
6 |
0 |
17 |
2017 - 2016 |
2 |
6 |
3 |
0 |
2 |
0 |
13 |
2016 - 2015 |
0 |
3 |
0 |
0 |
6 |
0 |
9 |
2015 - 2014 |
4 |
6 |
4 |
2 |
2 |
0 |
18 |
2014 - 2013 |
2 |
1 |
2 |
2 |
2 |
0 |
9 |
2013 - 2012 |
9 |
6 |
7 |
0 |
0 |
0 |
22 |
2012 - 2011 |
2 |
1 |
0 |
0 |
0 |
0 |
3 |
2011 - 2010 |
3 |
0 |
0 |
0 |
0 |
0 |
3 |
2010 - 2009 |
8 |
0 |
0 |
0 |
0 |
0 |
8 |
 |
|||||||
Number of PhD. graduates for each department |
|||||||
Academic year |
Economics |
Business administration |
Accounting |
Statistics |
Banking & financial sciences |
Management information system |
Total |
2024_2025 |
4 |
1 |
4 |
0 |
1 |
0 |
10 |
2023_2024 |
0 |
2 |
2 |
0 |
3 |
0 |
7 |
2022_2023 |
2 |
0 |
2 |
0 |
4 |
0 |
8 |
2021_2022 |
4 |
0 |
1 |
0 |
1 |
0 |
6 |
2020_2021 |
0 |
2 |
0 |
0 |
1 |
0 |
3 |
2020 - 2019 |
0 |
1 |
0 |
0 |
0 |
0 |
1 |
2019 - 2018 |
2 |
2 |
0 |
0 |
0 |
0 |
4 |
2018 - 2017 |
1 |
2 |
0 |
0 |
1 |
0 |
4 |
2017 - 2016 |
0 |
1 |
0 |
0 |
0 |
0 |
1 |
2016 - 2015 |
0 |
4 |
0 |
0 |
0 |
0 |
4 |
2015 - 2014 |
2 |
1 |
0 |
0 |
0 |
0 |
3 |
2014 - 2013 |
2 |
1 |
0 |
0 |
0 |
0 |
3 |
2013 - 2012 |
2 |
3 |
2 |
0 |
0 |
0 |
7 |
2012 - 2011 |
4 |
1 |
0 |
0 |
0 |
0 |
5 |
2011 - 2010 |
4 |
0 |
0 |
0 |
0 |
0 |
4 |
2010 - 2009 |
8 |
0 |
0 |
0 |
0 |
0 |
8 |
 |
|||||||
Average Acceptance for Preliminary Studies |
|
Academic year |
Minimum average |
2024_2025 |
Literary 60%Scientific 40% |
2023_2024 |
60 |
2022_2023 |
65 |
2021_2022 |
60.5 |
2020_2021 |
66.1 |
2020 - 2019 |
66.1 |
2019 - 2018 |
66.1 |
2018 - 2017 |
61.9 |
2017 - 2016 |
63.1 |
2016 - 2015 |
64 |
2015 - 2014 |
63 |
2014 - 2013 |
60 |
2013 - 2012 |
67.9 |
2012 - 2011 |
67.7 |
2011 - 2010 |
63.57 |
2010 - 2009 |
63.6 |
 |
|
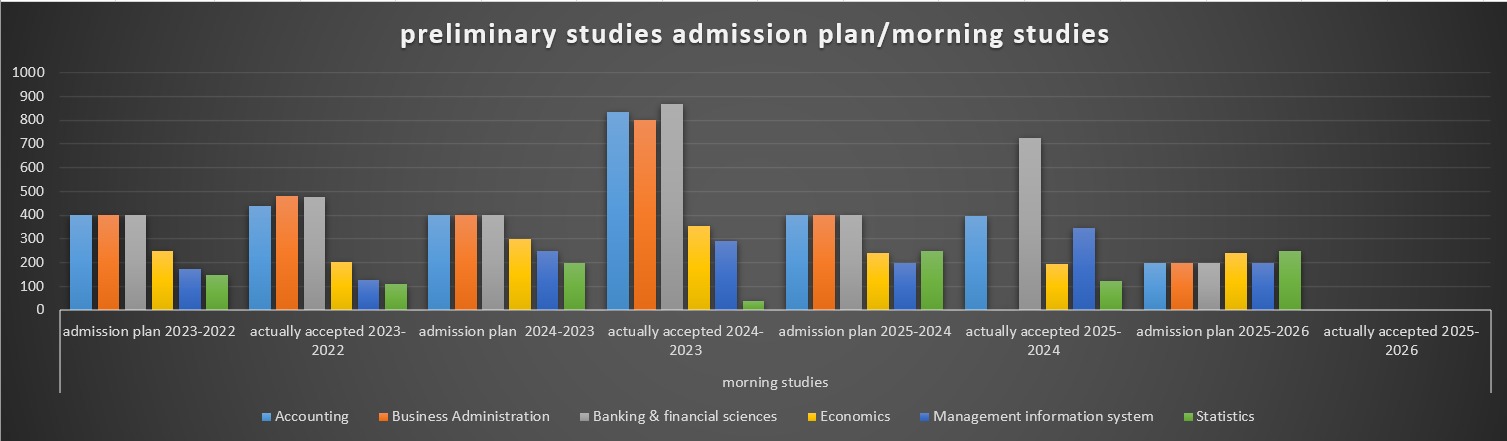
preliminary studies admission plan |
||||||||||||||||
department |
morning studies |
evening studies |
||||||||||||||
admission plan 2023-2022 |
actually accepted 2023-2022 |
admission plan 2024-2023 |
actually accepted 2024-2023 |
admission plan 2025-2024 |
actually accepted 2025-2024 | admission plan 2025-2026 |
actually accepted 2025-2026 |
admission plan 2023-2022 |
actually accepted 2023-2022 |
admission plan 2024-2023 |
actually accepted 2024-2023 |
admission plan 2025-2024 |
actually accepted 2025-2024 | admission plan 2025-2026 |
actually accepted 2025-2026 |
|
Accounting |
400 |
437 |
400 |
835 |
400 |
397 |
200 |
|
400 |
329 |
400 |
481 |
400 |
357 |
200 |
|
Business Administration |
400 |
480 |
400 |
801 |
400 |
496 |
200 |
|
400 |
273 |
400 |
438 |
400 |
379 |
200 |
|
Banking & financial sciences |
400 |
477 |
400 |
870 |
400 |
725 |
200 |
|
400 |
258 |
400 |
384 |
400 |
219 |
200 |
|
Economics |
250 |
205 |
300 |
353 |
240 |
195 |
240 |
|
250 |
2 |
300 |
0 |
150 |
45 |
150 |
|
Management information system |
175 |
129 |
250 |
291 |
200 |
348 |
200 |
|
175 |
62 |
150 |
69 |
200 |
85 |
200 |
|
Statistics |
150 |
111 |
200 |
40 |
250 |
124 |
250 |
|
150 |
1 |
100 |
0 |
100 |
0 |
100 |
|
total |
1775 |
1839 |
1950 |
3190 |
1890 |
2285 |
1290 |
|
1775 |
925 |
1750 |
1372 |
1650 |
1085 |
1050 |
|
 |
 |
|||||||||||||||
Admission plan of postgraduate studies 2025-2026 |
||||||
department |
Ph.D |
master |
higher diploma |
|||
admission plan |
actually accepted |
admission plan |
actually accepted |
Admission plan |
actually accepted |
|
Accounting |
9 |
4 |
20 |
30 |
0 |
0 |
Business Administration |
4 |
1 |
12 |
19 |
34 |
6 |
Banking & financial sciences |
8 |
1 |
8 |
10 |
0 |
0 |
Economics |
8 |
1 |
12 |
14 |
7 |
0 |
Statistics |
0 |
0 |
9 |
9 |
0 |
0 |
total |
29 |
7 |
61 |
82 |
41 |
6 |
 |
||||||
Acceptance plan of postgraduate studies |
||||||||||||||||||||
admission plan of postgraduate studies 2024-2025 |
admission plan of postgraduate studies 2023-2024 |
admission plan of postgraduate studies 2022-2023 |
||||||||||||||||||
department |
Ph.D |
master |
higher diploma |
department |
Ph.D |
master |
higher diploma |
department |
Ph.D |
master |
higher diploma |
|||||||||
admission plan |
actually accepted |
admission plan |
actually accepted |
Admission plan |
actually accepted |
admission plan |
actually accepted |
admission plan |
actually accepted |
Admission plan |
actually accepted |
admission plan |
actually accepted |
admission plan |
actually accepted |
Admission plan |
actually accepted |
|||
Accounting |
10 |
1 |
22 |
11 |
0 |
0 |
Accounting |
14 |
2 |
21 |
4 |
0 |
0 |
Accounting |
10 |
4 |
9 |
8 |
0 |
0 |
Business Administration |
4 |
1 |
7 |
11 |
15 |
8 |
Business Administration |
7 |
4 |
19 |
11 |
36 |
8 |
Business Administration |
7 |
2 |
24 |
29 |
36 |
4 |
Banking & financial sciences |
6 |
2 |
6 |
12 |
0 |
0 |
Banking & financial sciences |
12 |
0 |
12 |
17 |
0 |
0 |
Banking & financial sciences |
5 |
6 |
5 |
12 |
0 |
0 |
Economics |
7 |
4 |
10 |
14 |
10 |
0 |
Economics |
15 |
0 |
20 |
6 |
9 |
1 |
Economics |
7 |
1 |
20 |
27 |
7 |
1 |
Statistics |
0 |
0 |
10 |
6 |
0 |
0 |
Statistics |
0 |
0 |
10 |
10 |
0 |
0 |
Statistics |
0 |
0 |
8 |
11 |
0 |
0 |
total |
27 |
8 |
55 |
54 |
25 |
8 |
total |
48 |
6 |
82 |
48 |
45 |
9 |
total |
29 |
13 |
66 |
87 |
43 |
5 |
 |
 |
 |
||||||||||||||||||